This section describes the operating revenue, operating charges and operating results (surplus of revenues) of all the undertakings offering telecommunication services in Switzerland.
| 2018 | 2019 | 2020 | 2021 | 2022 | var. 21-22 | |
|---|---|---|---|---|---|---|
| Total operating revenue | 18'495 | 17'570 | 17'032 | 15'551 | 15'636 | 0.5% |
| Services on fixed networks | 5'133 | 3'922 | 4'112 | 3'953 | 3'953 | 0.0% |
| Services on mobile networks | 4'133 | 4'066 | 3'924 | 2'990 | 3'026 | 1.2% |
| Convergent grouped offerings (fixed and mobile network) a |
1'908 | 2'221 | 2'841 | 2'803 | 2'896 | 3.3% |
| Interconnection revenue | 3'410 | 3'617 | 2'619 | 2'478 | 2'261 | -8.8% |
| Other | 3'881 | 2'980 | 2'814 | 2'813 | 3'042 | 8.1% |
| Total operating expenses | 13'970 | 14'065 | 13'652 | 12'567 | 12'734 | 1.3% |
| Operating result | 5'056 | 3'527 | 3'576 | 2'686 | 2'662 | -0.9% |
a) This information was not collected before 2018.
- In this table, the sums do not always correspond exactly to the constituent elements. These slight differences are due to rounding up or down.
- Since 2009, 273 providers who transmit only radio and television programme services no longer have to participate in the statistics. In 2008, they had operational revenue (excl. VAT) of CHF 78.3 million.
- Since 1 April 2007, broadcasting of programme services has been considered as a telecommunication service, in the same way as telephony or the internet, for example. Thus more than 400 companies which offer this type of service became telecommunications service providers in 2007.
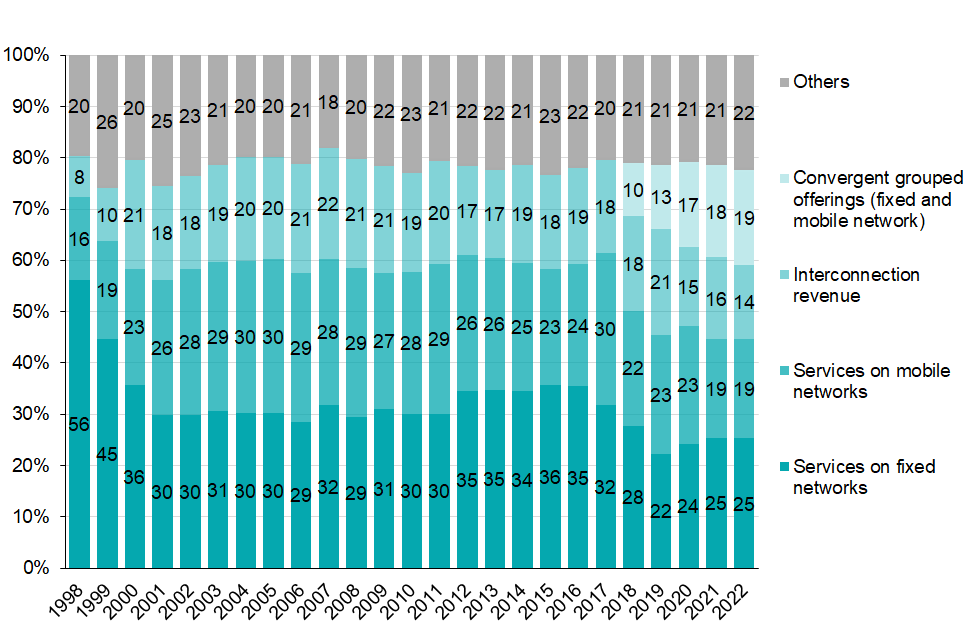
Breakdown of operating revenue
Facts and figures
In the following Excel file, you will find detailed information, figures and graphs.
Last modification 26.03.2024