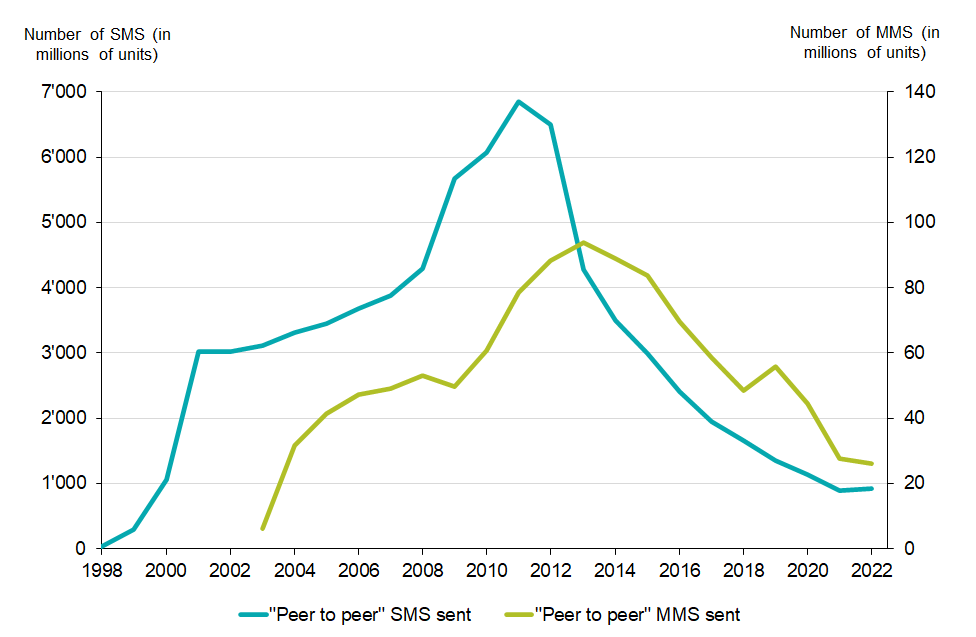
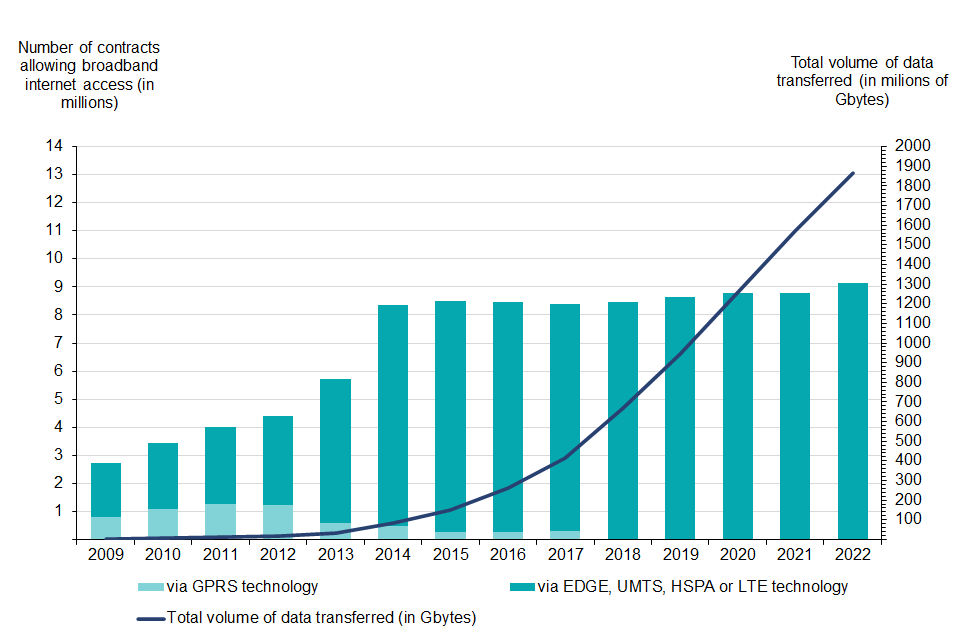
This section describes the consumption of services on mobile networks which are not covered by the universal service, such as SMS (Short Message System), MMS (Multimedia Message Service) or broadband internet access.
| Year | Number of SMS and MMS (in millions of units, for the period from 01.01 to 31.12) | ||
|---|---|---|---|
| "Peer to peer" SMS sent a | "Peer to peer" MMS sent a | Value-added SMS and MMS billed Total | |
| 2018 | 1'662 | 48.5 | 76.2 |
| 2019 | 1'346 | 55.9 | 58.4 |
| 2020 | 1'135 | 44.4 | 37.3 |
| 2021 | 889 | 27.5 | 146.6 |
| 2022 | 917 | 26.2 | 130.6 |
| var. 21-22 | 3.1% | -4.7% | -10.9% |
a) By your customers on your own network and by your customers on a rival network.
SMS is a service specific to 2nd generation mobile telephony (GSM). It must also be pointed that table SM4A collects only the SMS and MMS sent by customers of service providers offering mobile phone subscriptions. Other companies offer "Premium service" SMS which are SMS information messages in specialised areas (e.g.: traffic information, sports, weather).

| 2019 | 2020 | 2021 | 2022 | var. 21-22 | |
|---|---|---|---|---|---|
| Number of contracts allowing broadband internet access | 8'628'248 | 8'771'526 | 8'783'431 | 9'145'495 | 4.1% |
| via GPRS technology only a | 10 | 11'304 | 0 | 0 | - |
| via EDGE, UMTS, HSPA or LTE technology | 8'628'248 | 8'760'222 | 8'783'431 | 9'145'495 | 4.1% |
| Total volume of data transferred (in Gbytes) | 946'244'261 | 1'257'812'468 | 1'572'338'526 | 1'867'496'862 | 18.8% |
a) Contracts or pre-paid cards; actual internet access for the period from 01.10. to 31.12.

Facts and figures
In the following Excel file, you will find detailed information, figures and graphs.
Last modification 27.03.2024


